Abstract
The lottery is supposed to be a game of chance. So let's check if it's true !
For this study, I get the past result of the french lottery available
here
from October 2008 to to February 2016 with a total of 1152 trials.
The goals of this post are first to be present concrete application of statistical tests on real data and then
look for some funny features that could be in the lottery dataset.
The chi2 test being the most known statistical test, I will first give a short introduction on how this test works
as an example for statistical tests and show how to compute the
statistic with an experiment on dice. Then, we will move to the lottery dataset to first check randomness hypothesis
on the output results using our chi2 test knowledge. Finally, We will look for some behaviour that may
appears in this datasets.
From time to time I will try to edit this article adding result for a new features that may appear in the data
and also update the dataset with the new data. Here are the findings so far.
- Choose the 'numero chance' 1
- There are 42% less winners on Mondays than the rest of the week. Let's play on Mondays to have less
opponent and less people to share little win with ?
- There are 42% less winners in June than the rest of the year.
You can either read the text version of this article to learn more about the chi2 test and see the results, or
the python notebook version to see the code behind the results. There will be less explanation is the
notebook version but it could be interesting to see what is behind.
The python code is also available on my
github.
The chi2 test (chi squared test) is a statistical test use to check if a given sample follow a particular law or
to check if the difference between two sets of categorical
variables happened by chance (because they are just different samples from the same distribution) or if they are really
different.
To do so, we have to define the null hypothesis H0 that state that the frequency distribution of
the observed distrution follow a particular theoretical distribution (or state that the two sets
are sample of the same law). For each test, the chi2 square formula
will return the chi2 statistic of the current estimation. Given the obtained value we either accept or reject
the null hypothesis. To decide, the statiscian has a chi2 table (available online), which will tell the probability
of obtaining the greater value of the statistic given the degree of freedom (the statistic worth 0 is the sample
follow perfectly the theoretical distribution). Most of the time, if the obtain statistic is lower than the 5%
threshold (that is there is more than 5% of chance to obtain a greater statistic from a real sample for the theoretical
distribution) we accept the null hypothesis. An other way to decide is to compute the p-value. The p-value is
the smallest level at which the test would reject the null hypothesis. If p is lower than 0.05, meaning that
there is less than 5% of chance to obtain a greater statistic from a real sample for the theoretical
distribution, we reject H0.
In practice the chi2 table is construct with monte carlo method. The protocol consist in simulation a sample
from the theoretical distribution, compute the chi2 statistic and store it. We do this process a lot of time
(100 000 times for instance). From all this realisation, we can then compute an estimation of the probability
of having a score greater than x and being really sample from the theoretical distribution.
For this experiment the protocol consist in rolling a dice $n$ times. Thus we except to get each number $n/6=p$ times.
The corresponding chi2 test is then the normalize square difference between the number of times we get each number
and the theorethical number (here $p$):
$$ T = \sum_{i=1}^6 \frac{(\text{number of }i - p)^2}{p}$$
We repeat this process an important number of times which will give us a range a possible values an their corresponding
experimental probability. I run this test 10000 times, rolling the dice (with a computer of course) for each test 1000 times.
Taking the 95% percentile, I get the value 11.06, which is close to the table value of 11.07 for 5 degrees of
freedom. There are 5 degrees of freedom because we know the total number of test, so if I give you the number of
times I obtained the number from 1 to 5, you can directly know how many times I get the number 6.
Making much more test will make us converge to this value.
With this short introducton on the chi2 test, we can now check several randomness hypothesis on the lottery output.
We will check if all the number are really equiprobable, likewise for the joker number and for pairs of number.
Then we will look at the winning probability evolution with time (is it harder and harder to win ?). Finally,
if there is several winner at the same rank (the same number of correct number), the price is divided between them.
Thus maybe there is a better day of the week or the month to play if there are less opponents ?
Let's look in the historicl data to see if there is some number that we should play to increase a little our
winning chance.
The first thing we check is each number individually. There are 49 possibilities, there have been 1152 trials and
5 balls are out at each trials so we should have seen each number around 117 times. Here is the number of times
we have seen each number.
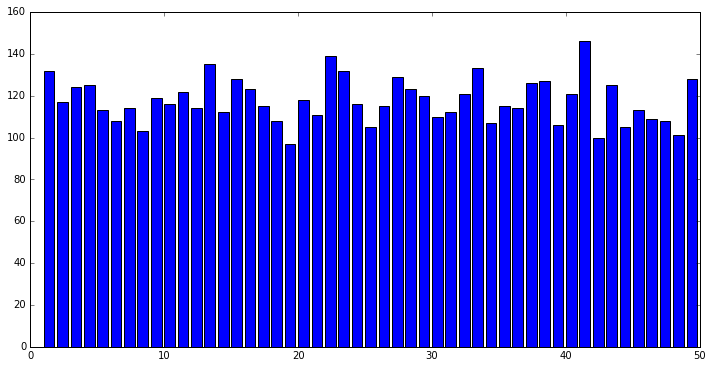
To check if this difference is odd or not, we use a chi2 test ! After computation we found a statistic of 45.87,
which is far below the 5% threshold. The p-value is 0.56, so really high. We can be very confident that this number
are really random.
Let's move to the 'numero chance'. This number is an other number outputed by the french lottery and can be between
1 and 10. If you can the right one, you get extra money. As there is only one 'numero chance', we should have
seen each number around 1152/10 = 115 times. Here is the number of times
we have seen each number.
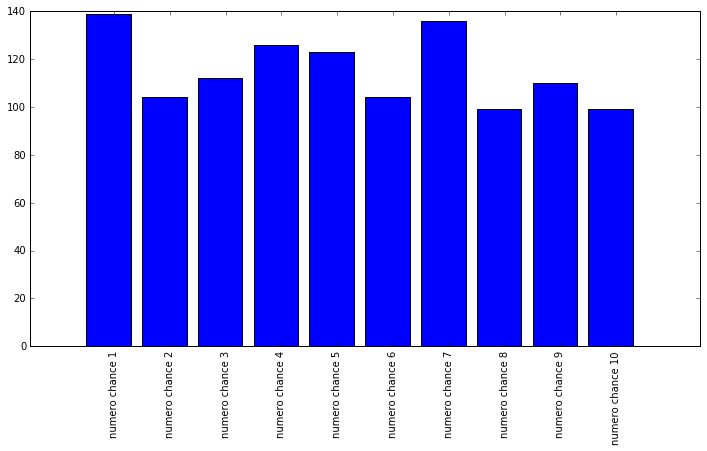
The number 1 seems to get pull at little more often ... Let's check it with a chi2 test ! The computation gives
a statistic of 17.27 and the 5% threshold with 9 degrees of freedom is ... 16.92 ! So we should reject the H0
hypothesis and maybe it would be a good strategy to play the number 1 as the 'numero chance'. However, there is
only one numero chance for each trial whereas regular number are pull five times, so we have more observations
for them. But as far as we know, 1 is a good number !
Is there two numbers that are more often pick together ? If so, maybe we should put these two in our grill to
increase our chance. Here is the repartition of the pairs.
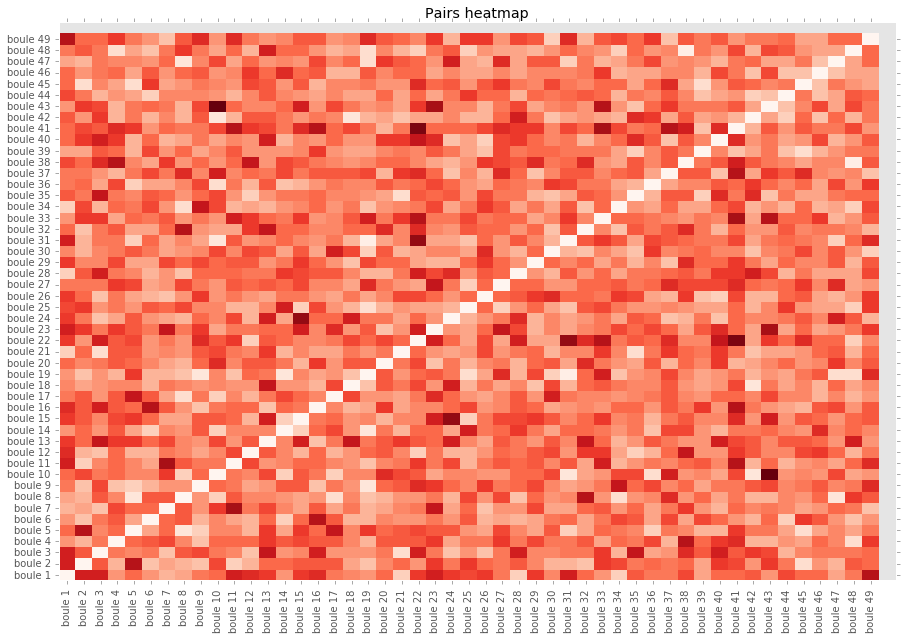
There are 49*48/2 = 1176 possibilities. In a trial there are 10 possibles pairs, so we have observed 11520 pairs
in our dataset. Each pairs should have be seen around 9 or 10 times. Here the maximum value is obtained for the
pair (43,10) obtained 22 times and the mean is 9.59. The chi2 test gives a statistic of 1224.49. I did not find
the table for such a high number of degrees of freedom, but python return a p-value of 0.15 which is high enough
to accept the H0 hypothesis and say that those results are random.
This section will be a miscellaneous of possible features that may appear in the data. I'll try to edit
this section from time to time.
Does to winning probability change over time ? Is there more winner now than before ? I don't have access to the
number of participant neither to the winning prize, so the winning probability and the expected prize can not
be computed. But assuming that the game is random (as we check before), I assume that the winning probability is
stable, so if there are less winners, I assume that there are less participants, so less people to split little
win with...
... the years
Here are the number of people that have n correct numbers over 6 (5 + numero chance), over time.
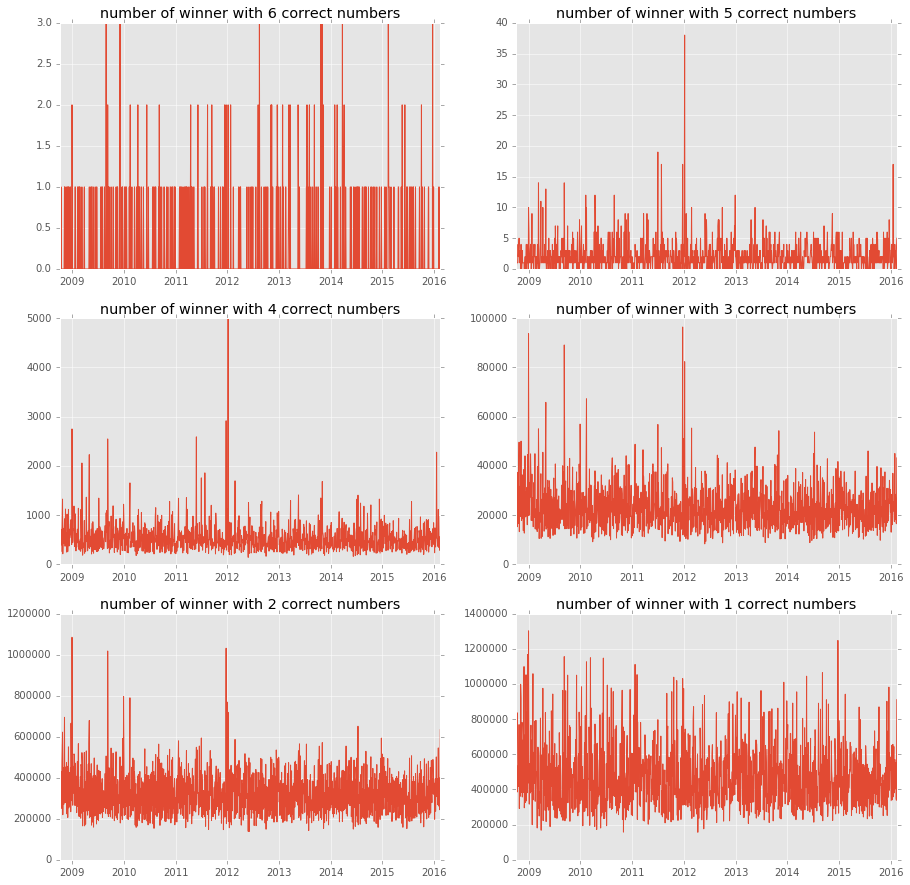
There seems to be a lot of lucky people at the begining ot 2012 ! Otherwise there does not seems to
be a winning trend over the years, so there is not more people playing now than before.
... the day of the week
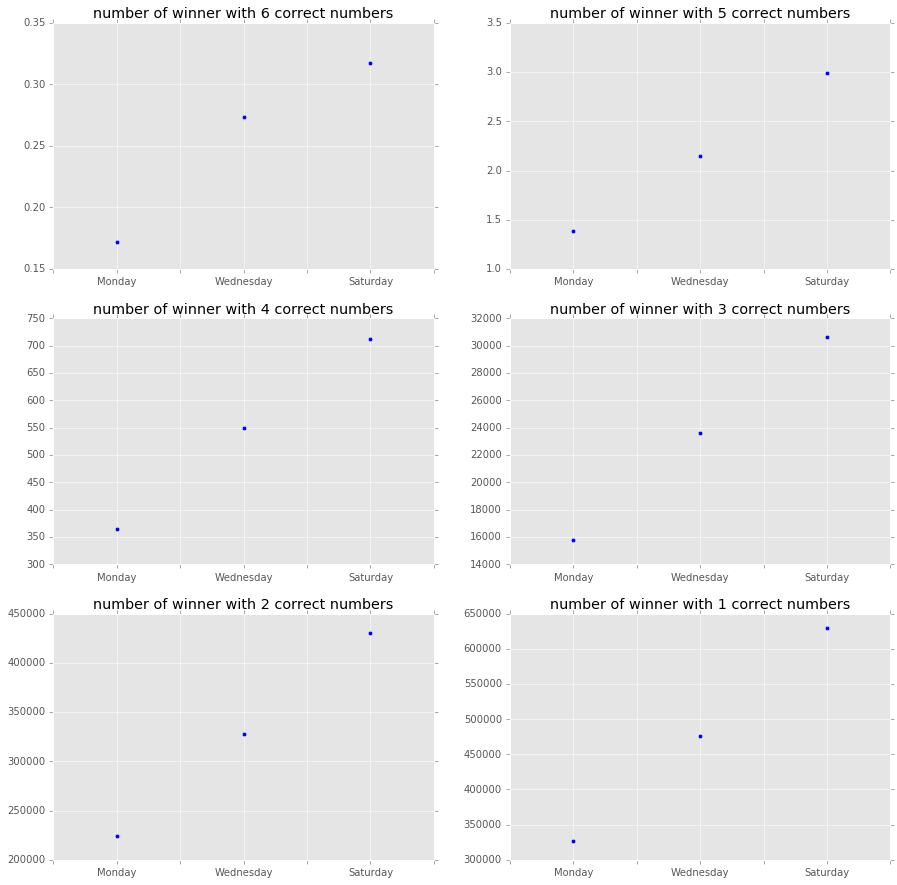
There are far less people winning on Monday. Most people seems to play on week end, so if there were no
big winners during the week-end, meaning the prize is still high, it may be good to play the next Monday.
There are in average 40% less winners (thus opponents) on Mondays.
... the month of the year
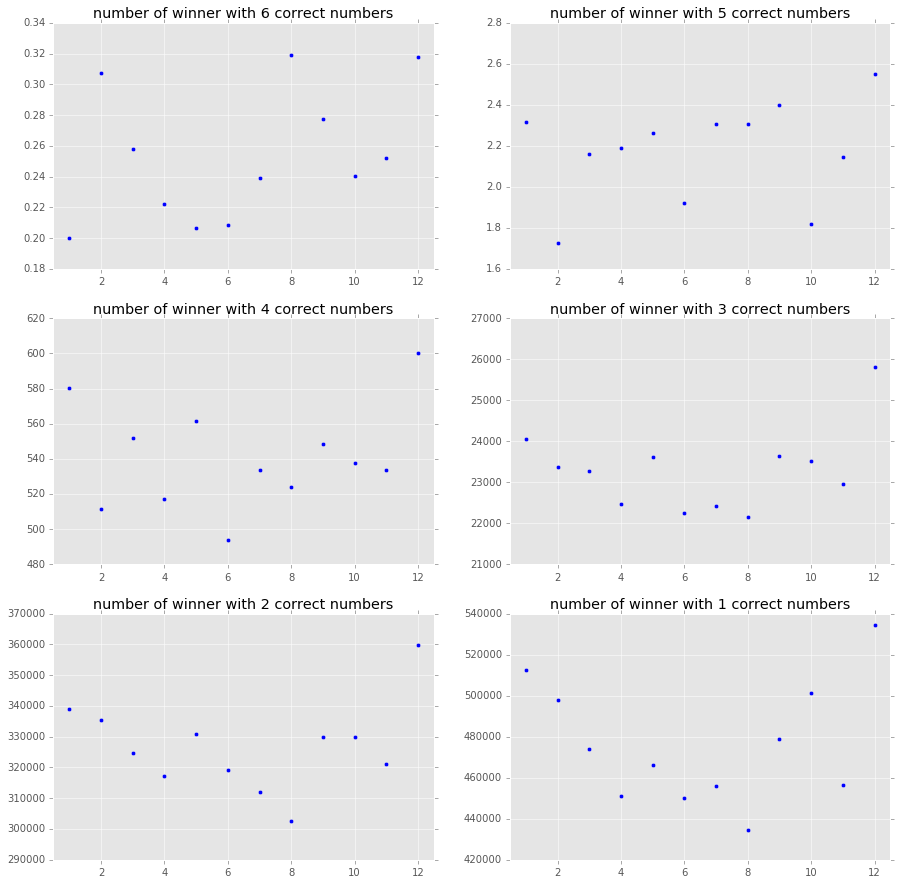
It seems to be less opponents during summer time, 9% less in June.